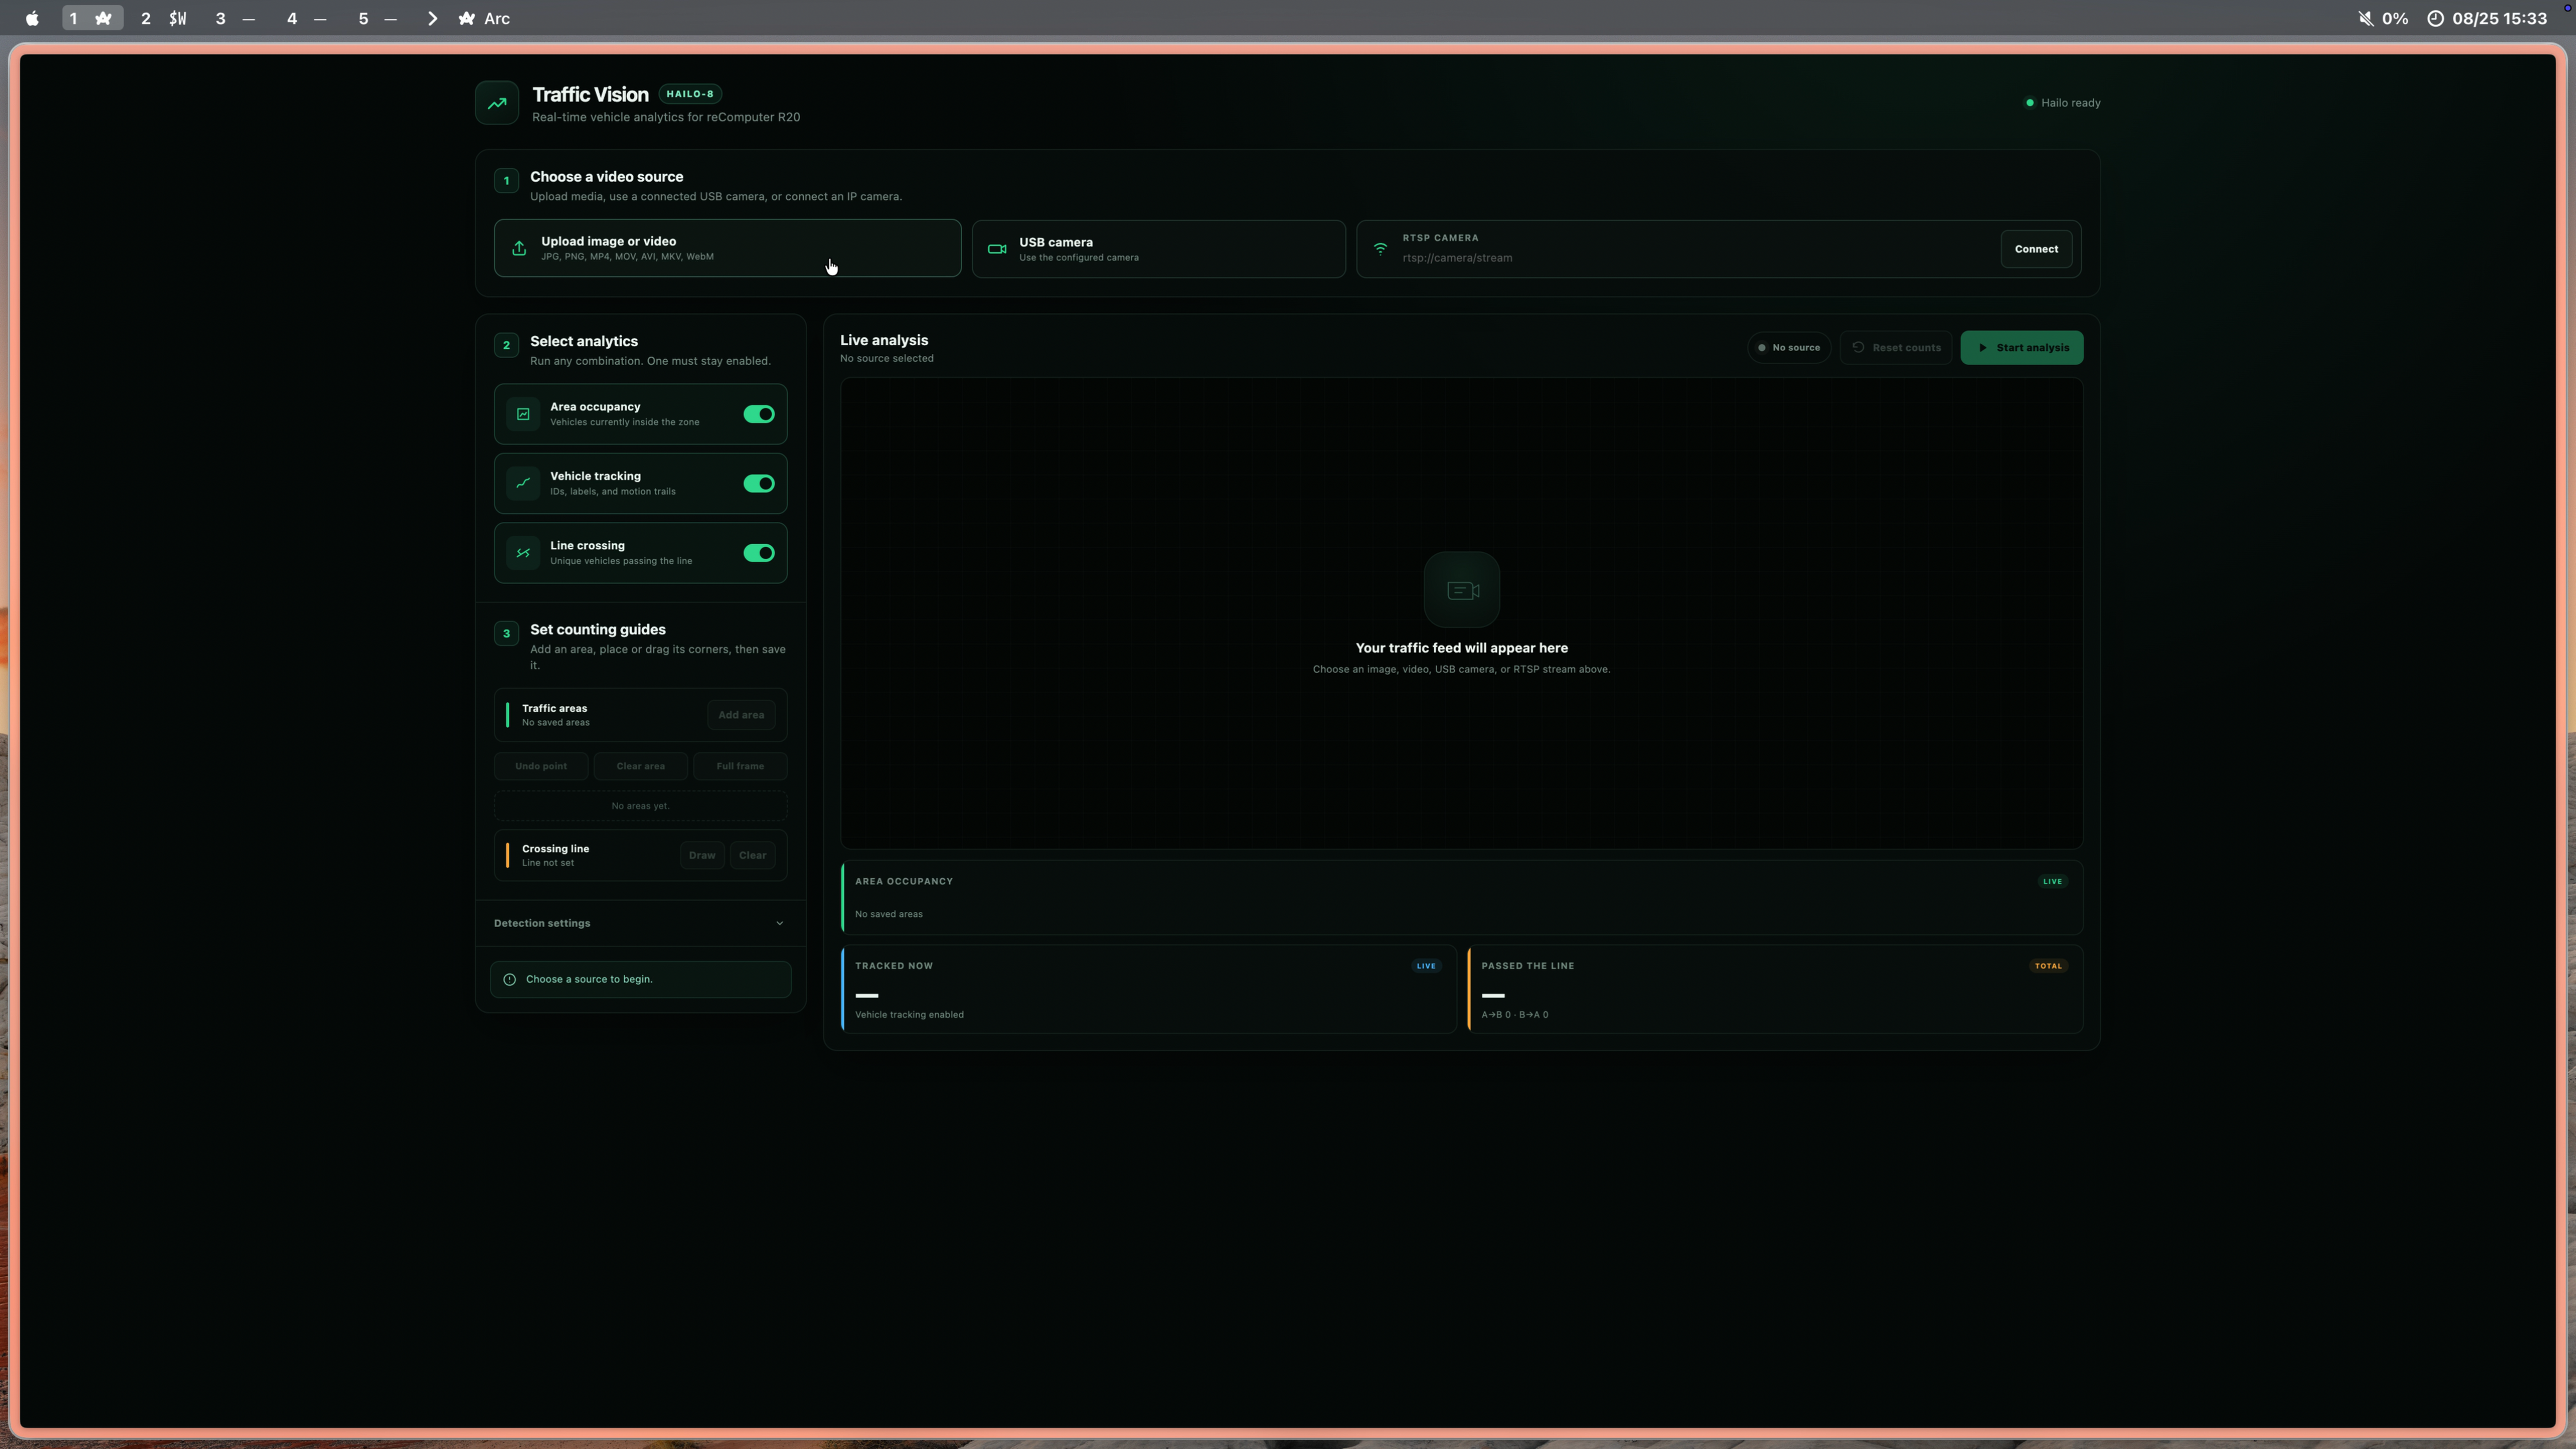
This project turns a Raspberry Pi 5 and Hailo-8 into a local traffic analytics system. It detects vehicles with YOLOv11 and presents the results in a browser. You can use an uploaded image or video, a USB camera, or an RTSP camera.
1. What Is Traffic Analytics?
Traffic Analytics adds useful rules on top of vehicle detection:
| Function | What it shows |
|---|---|
| Area counting | Number of vehicles inside each user-drawn area |
| Vehicle tracking | A stable ID and short movement trail for each vehicle |
| Line crossing | Total crossings and separate A→B and B→A counts |
The browser is used to select a source, draw areas and a crossing line, and view the results. All processing stays on the Raspberry Pi.
The Hailo-8 runs YOLOv11 inference. The Raspberry Pi handles video input, tracking, counting, and the web dashboard.
Image, video, USB camera, or RTSP camera
                    │
                    ▼
             FastAPI backend
                    │
                    ▼
        YOLOv11 inference on Hailo-8
                    │
                    ▼
       Area count · Track · Line count
                    │
                    ▼
             Browser dashboard
The application detects bicycles, cars, motorcycles, buses, and trucks. One inference result is shared by every enabled traffic function.
2. Three Analytics and Using Them Together
Area counting
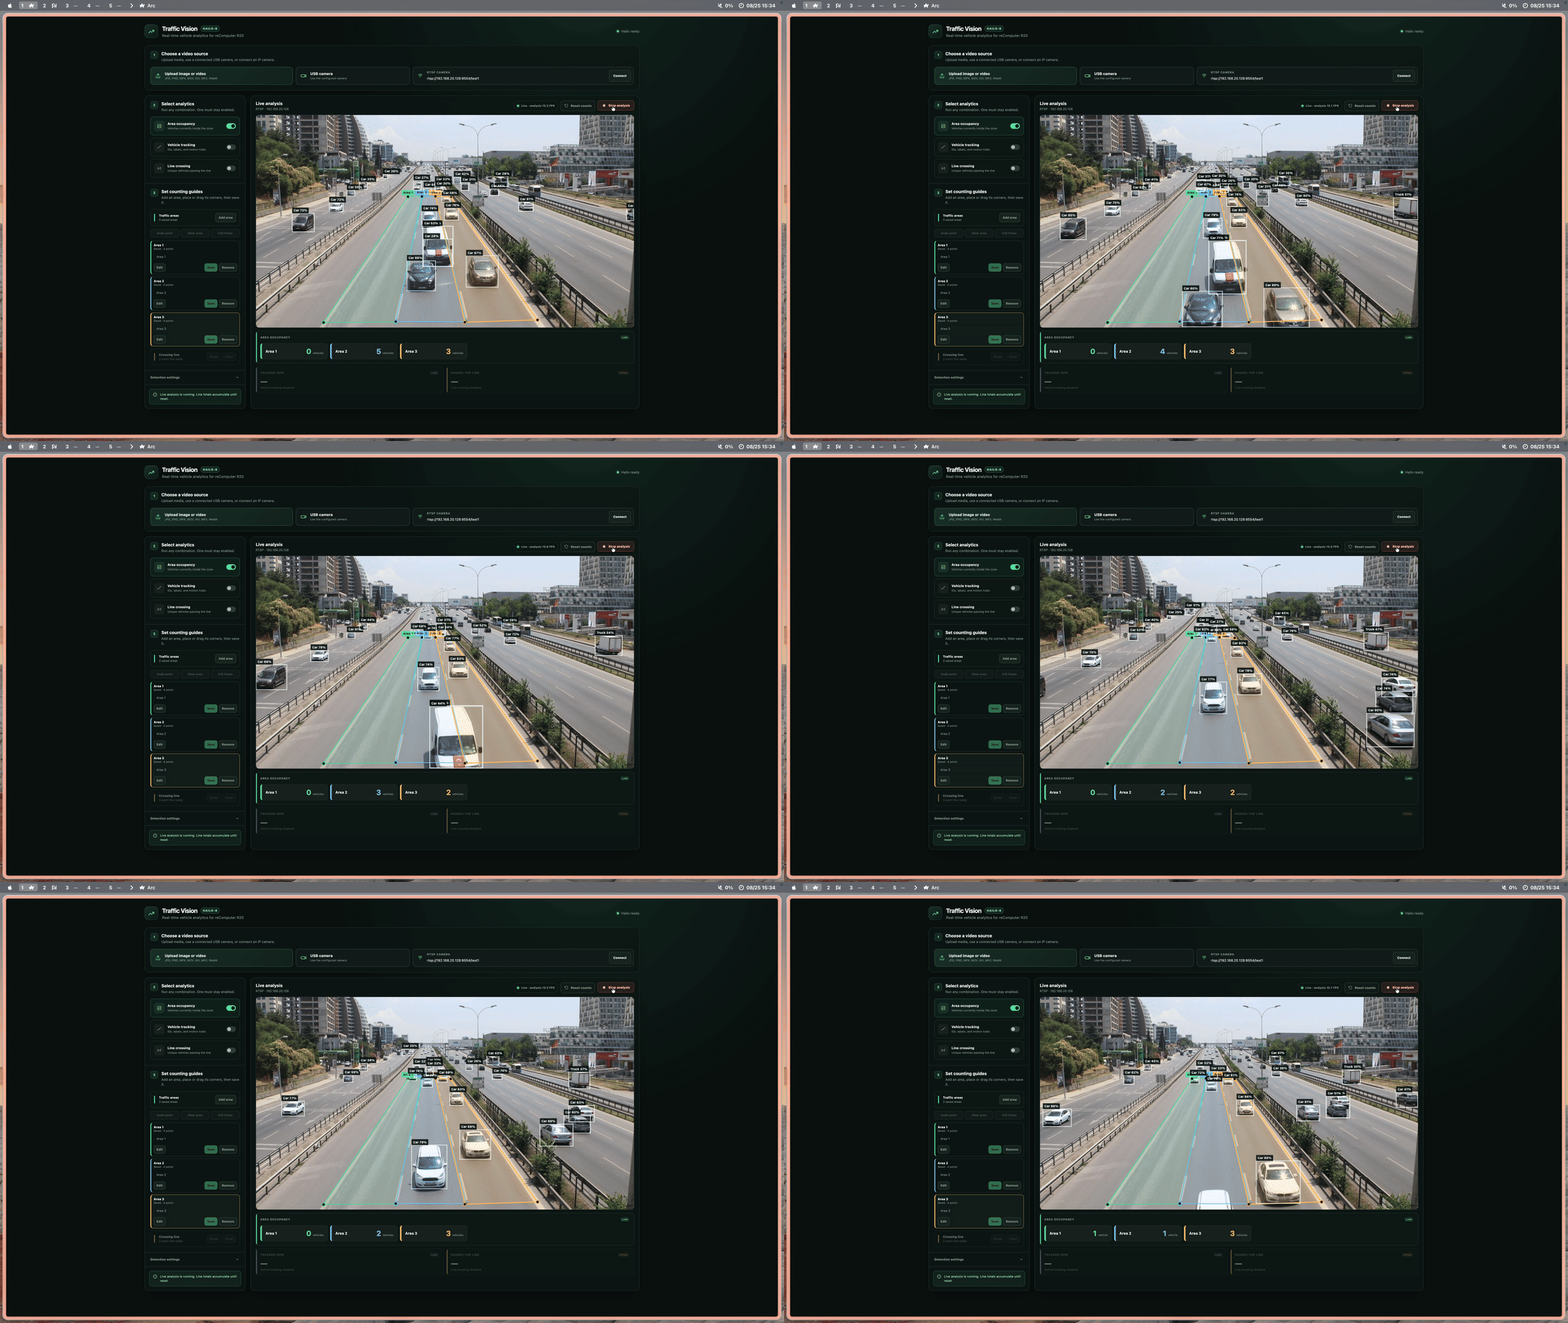
Draw a polygon over the road, entrance, parking zone, or another area. A vehicle is counted when the center of its detection is inside the saved polygon.
You can create several named areas. Each area has its own total and vehicle-class breakdown. If areas overlap, a vehicle inside both is counted once in each area.
Vehicle tracking
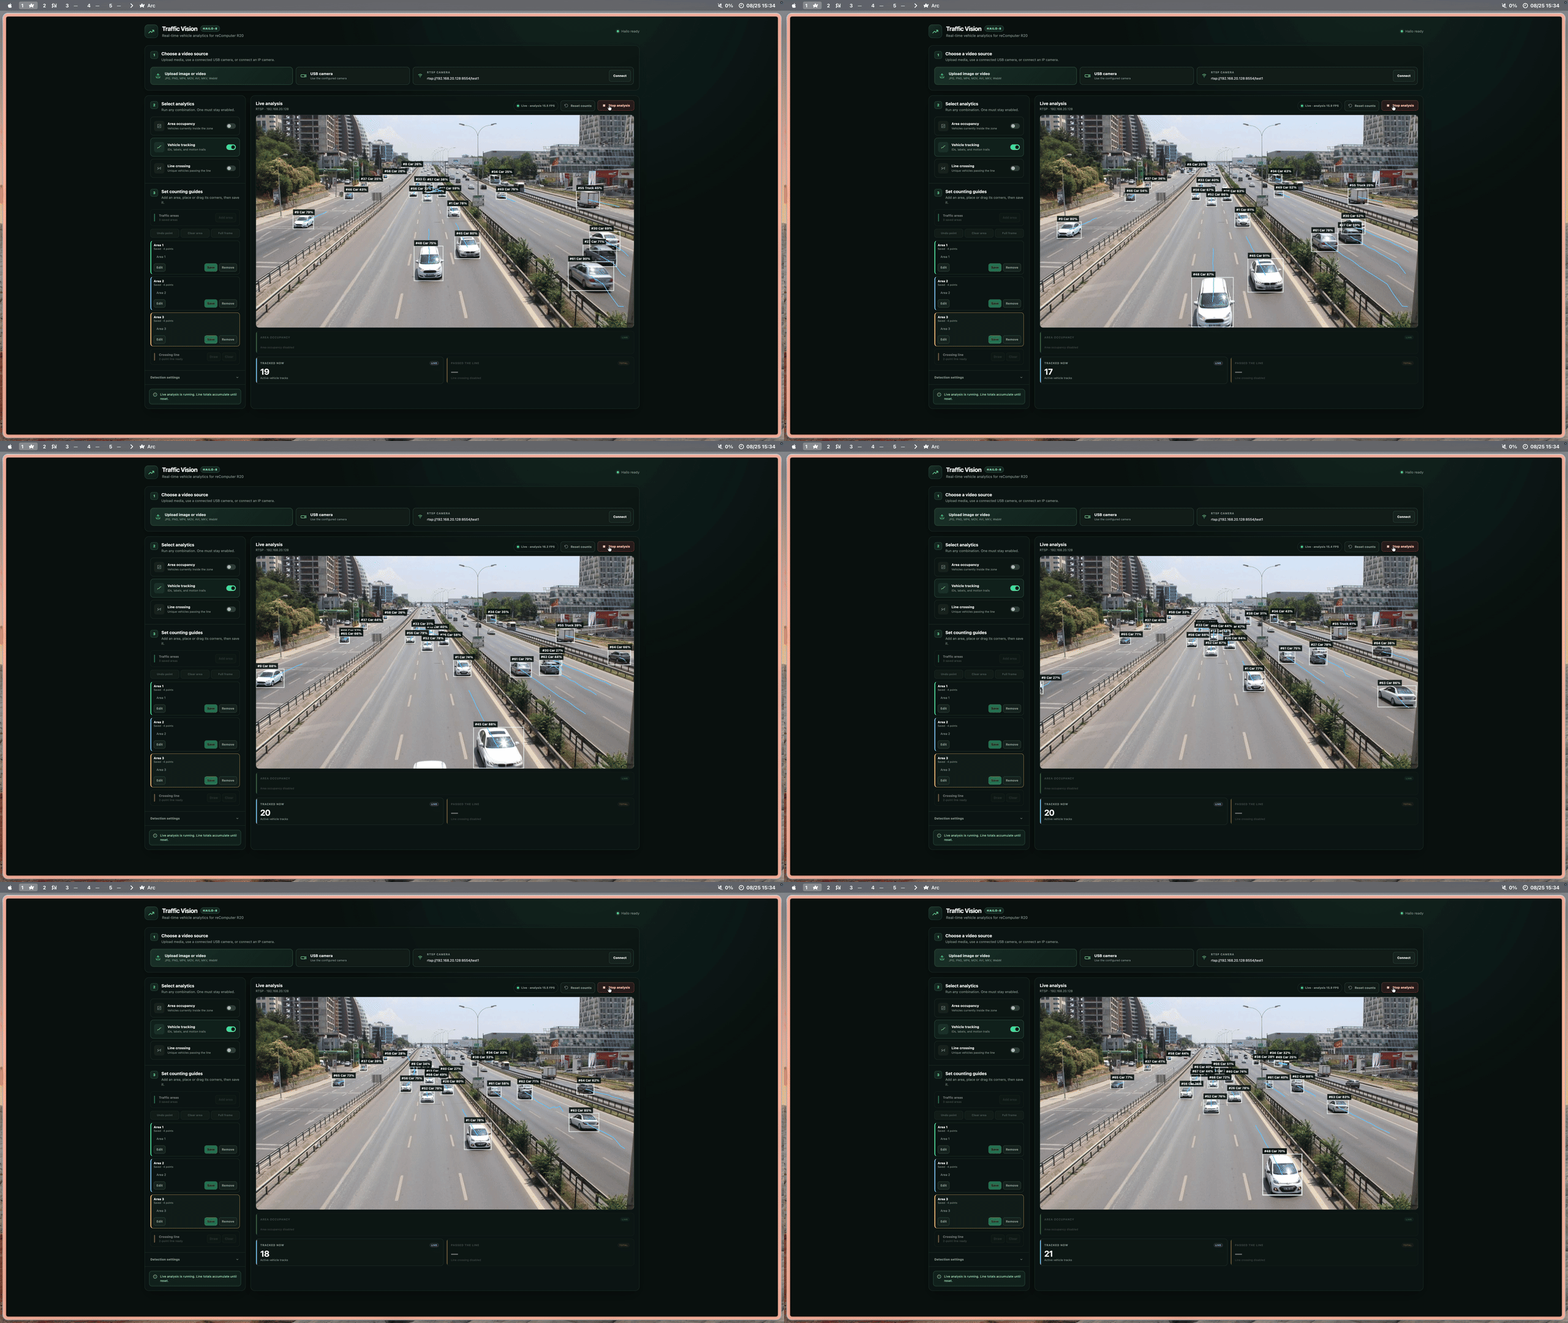
Tracking gives each vehicle an ID and draws a short trail behind it. This makes the direction and recent path of each vehicle easy to see.
Tracks expire when a vehicle disappears for too long. Trails are also cleared after a large position jump, preventing incorrect lines across the image.
Directional line crossing
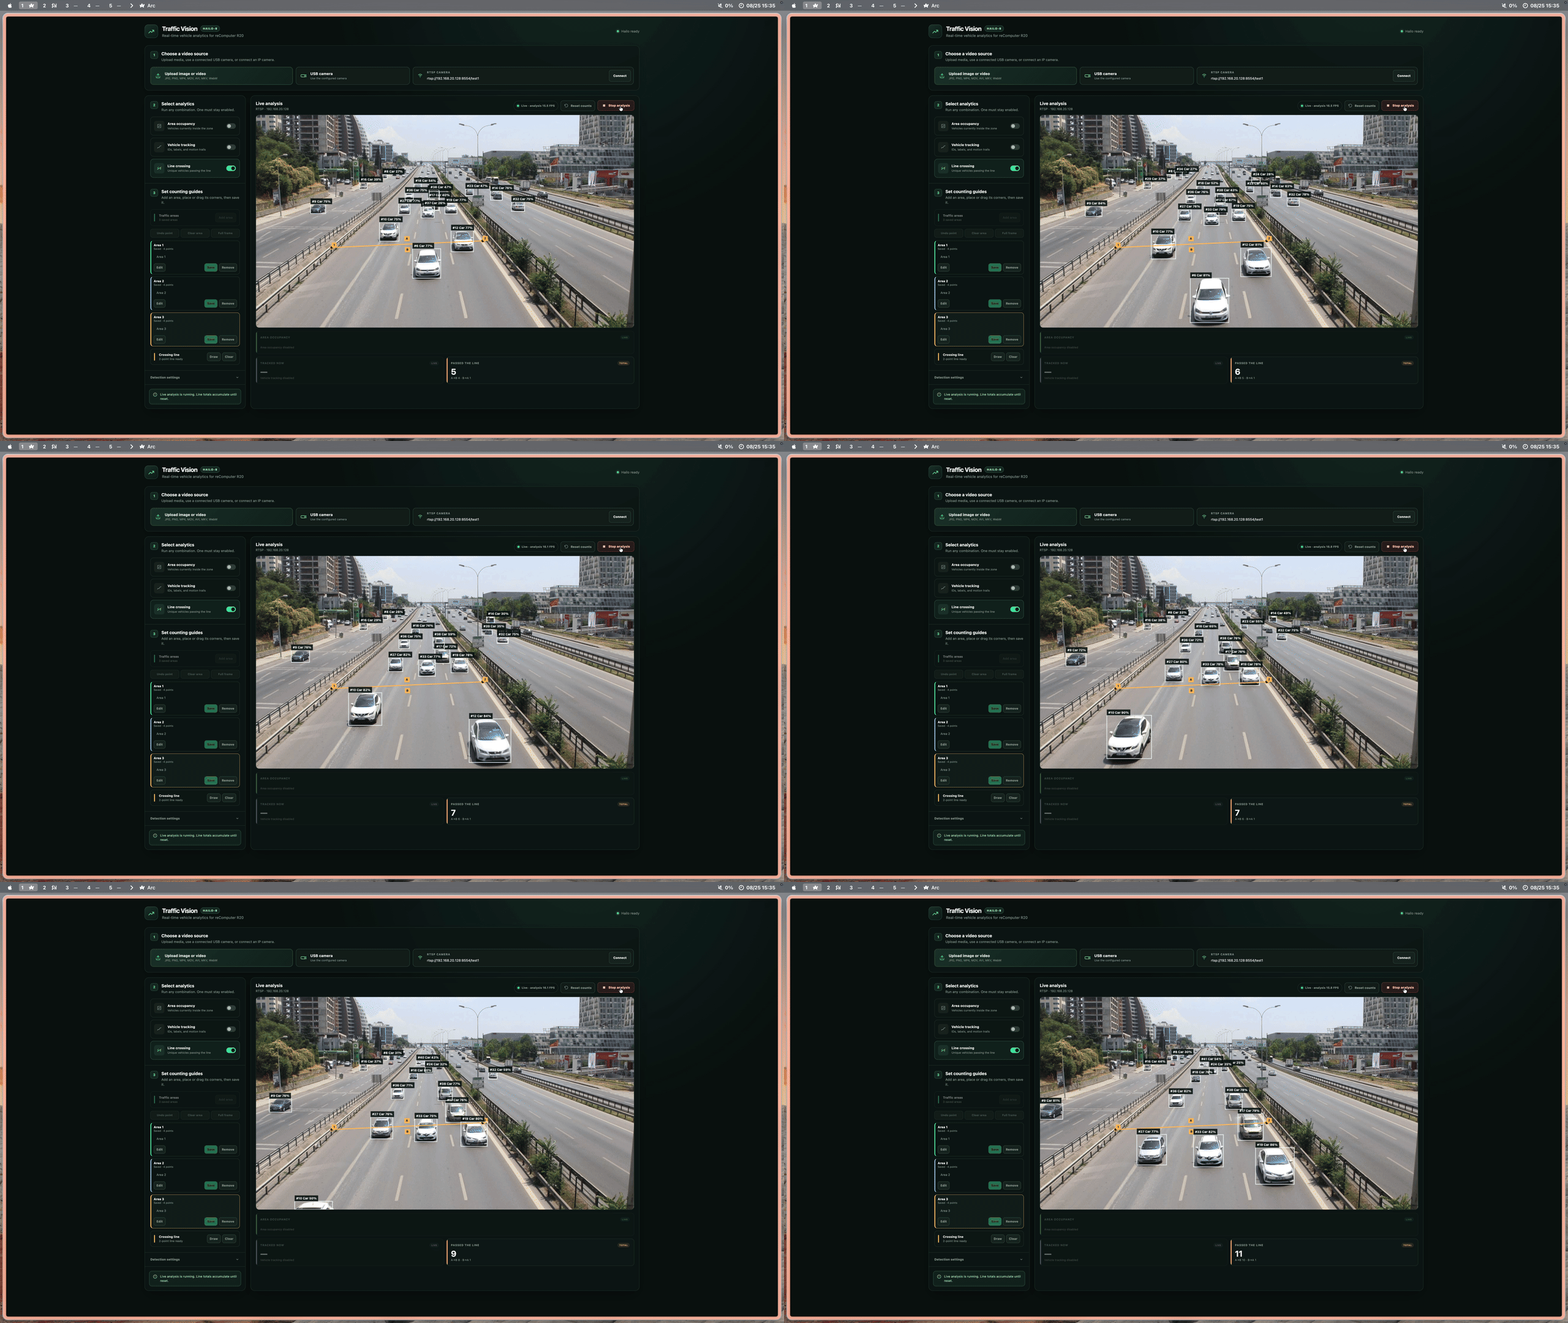
Draw a line with endpoints A and B. When a tracked vehicle crosses the line, the dashboard updates:
- Total crossings
- A→B crossings
- B→A crossings
Each track is counted only once. The vehicle path must cross the drawn line segment, so movement elsewhere in the frame does not change the count.
Use all three together
Area counting, tracking, and line crossing can run together. They reuse the same YOLOv11 detections, so enabling all three does not run the model three times.
To show all functions:
- Select an image, video, USB camera, or RTSP source.
- Enable Area count, Vehicle track, and Line count.
- Draw and save at least one counting area.
- Draw the two-point crossing line.
- Select Analyze image or Start analysis.
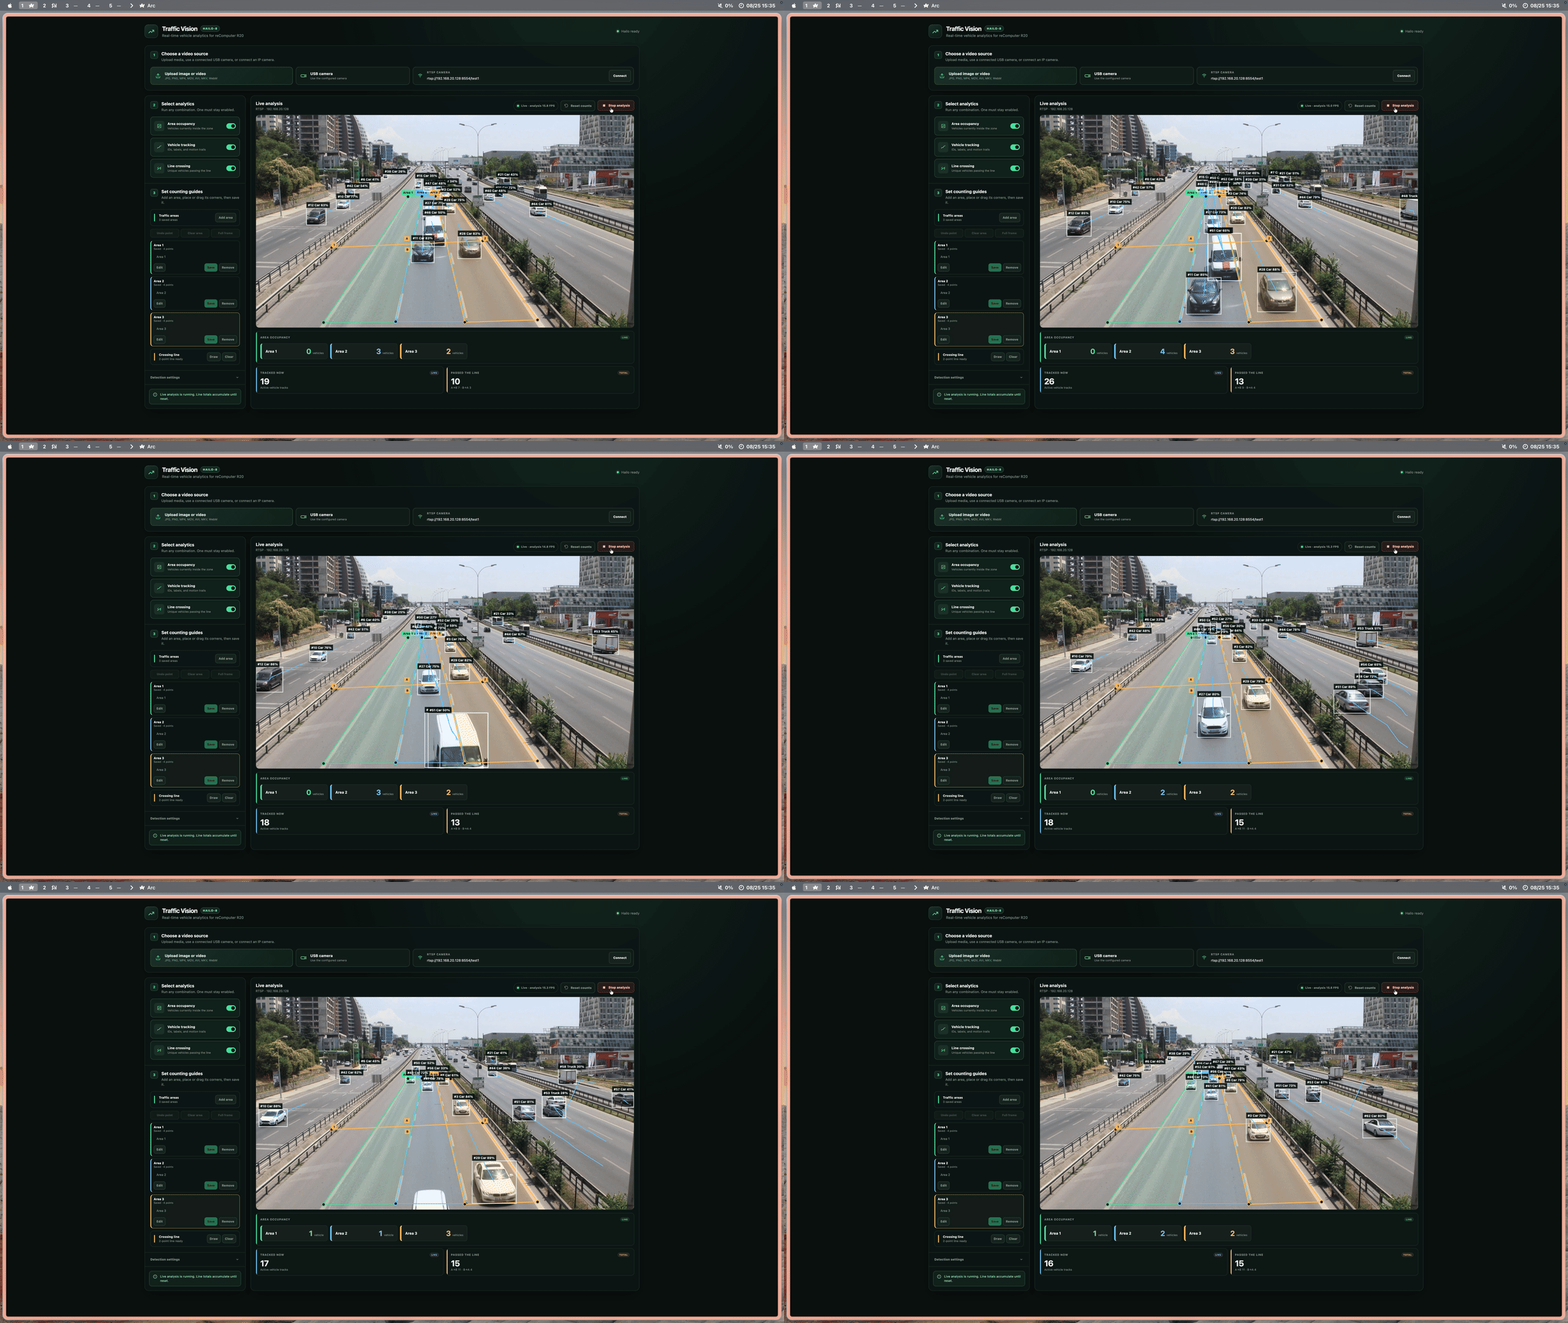
The dashboard then shows current area occupancy, vehicle paths, and directional crossing totals over the same traffic feed.
3. Run It on Raspberry Pi 5 with Hailo-8
Requirements
- Raspberry Pi 5 or reComputer R20 with 64-bit Raspberry Pi OS Bookworm
- Hailo-8 accelerator
- Internet access during installation
- An image, video, USB camera, or RTSP camera
Install and verify HailoRT
sudo apt update
sudo apt install hailo-all
sudo reboot
After rebooting, verify the system:
uname -m
hailortcli fw-control identify
ls /dev/hailo0
The architecture must be aarch64, and the Hailo device must be visible.
Clone the project
git clone https://github.com/Hanzo-Huang/pi-ai-demos.git
cd pi-ai-demos
Install Miniforge and Python 3.12
The included HailoRT wheel requires CPython 3.12, Linux ARM64, and HailoRT 4.23. Miniforge provides Python 3.12 without changing the system Python.
sudo apt install curl
curl -L -O https://github.com/conda-forge/miniforge/releases/latest/download/Miniforge3-Linux-aarch64.sh
bash Miniforge3-Linux-aarch64.sh
Allow the installer to initialize the shell, then close and reopen the terminal. Create the project environment:
conda config --set auto_activate_base false
conda create --name pi-hailo python=3.12 pip -y
conda activate pi-hailo
python --version
python -m pip install -r requirements.txt
python -m pip install runtime/wheels/hailort-4.23.0-cp312-cp312-linux_aarch64.whl
Python must report version 3.12.x. If the installed HailoRT driver is not 4.23, install a HailoRT Python wheel that matches the driver.
Verify the Python packages:
python -c "import cv2, fastapi, hailo_platform, numpy; print('Python dependencies: OK')"Start Traffic Analytics
Start without a USB camera:
python examples/cv/traffic-analytics/run.py --camera-id -1Open the dashboard at:
http://PI_IP_ADDRESS:8000To use the first USB camera, start with:
python examples/cv/traffic-analytics/run.py --camera-id 0For an RTSP camera, start with camera ID -1, open the dashboard, enter the full rtsp:// or rtsps:// URL, and select Connect.
Check the application
From another terminal, run:
curl http://127.0.0.1:8000/api/healthThe response should report model_exists as true and hailo_platform_importable as true. If either is false, check that models/yolov11n.hef exists and that the HailoRT wheel matches the driver, Python version, and ARM64 architecture.
Traffic Analytics is now ready. Select a source, draw the guides needed by the enabled functions, and start the analysis.